TradingView Demo Web Application
Introducing the TradingView Demo Web Application: a fintech showcase replicating TradingView’s advanced charting tools, real-time market insights, and dynamic alerts. Highlights include customizable chart types (candles, Renko, Heikin Ashi), technical analysis features (trend lines, Fibonacci retracements, pattern recognition), comprehensive statistics (market cap, P/E, earnings charts, seasonals), and responsive notifications. Accessible at https://tradingview.scaleragency.io/, it elevates your platform’s data visualization and decision-making capabilities.
TradingView Demo Web Application URL: https://tradingview.scaleragency.io/
As part of our commitment to showcasing cutting-edge fintech solutions, we have developed a demo web application inspired by TradingView, the leading platform in advanced financial charting tools. This demo illustrates our capability in integrating sophisticated trading chart tools that can empower your financial applications with real-time data visualization and analysis.

Features Highlight
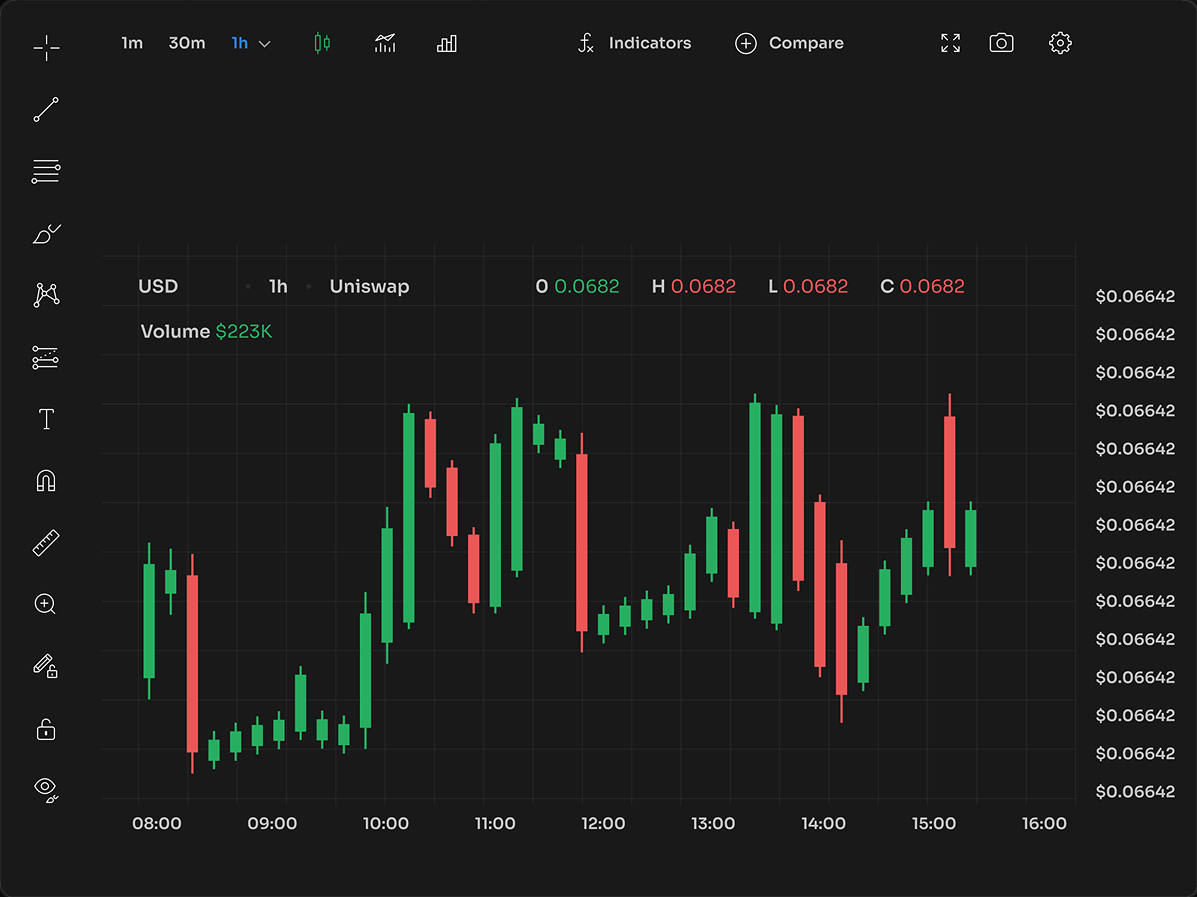
Advanced Charting: Our application incorporates comprehensive charting options that allow users to visualize financial data with precision. Users can customize charts according to their trading preferences, akin to the flexibility seen in TradingView’s robust charting capabilities.
Market Insights: Gain real-time insights into market trends and price movements, enabling informed decision-making.
Alerts System: We’ve implemented a responsive alert system that notifies users of significant market events or price changes, ensuring that no critical information is missed. This feature mirrors the utility found in TradingView’s alert tools, which you can explore in detail.
Key Features Include
Basic Data and Trading Ranges: Users can view daily trading ranges and historical data spanning 52 weeks, offering a broad perspective on market dynamics.
Key Statistics: The platform displays crucial statistics including:
Next Earnings Report: Timely updates on upcoming earnings to keep users informed.
Average Volume: Insight into trading activity levels.
Market Cap: Overall market value of the publicly traded shares of a company.
Dividend Yield: Information on expected dividend returns relative to the stock price.
Price to Earnings Ratio: A key indicator of market expectations and stock valuation.
Basic EPS (Earnings Per Share): Measures a company’s profitability.
Shares Float: The regular stocks available for public trading.
Beta: A measure of a stock's volatility in relation to the overall market.
Earnings Chart: Visual representation of earnings history.
Payout Ratio: Percentage of earnings paid out as dividends.
Annual and Quarterly Income Statements: Detailed breakdowns of revenue, net income, and net margins.
Performance Graph: Tracks stock performance over time.
Seasonals: Shows seasonal patterns in stock performance.
Profile Info: Comprehensive background information on companies.

Chart Customization Options:
Chart Types: Users can choose from various chart types such as bars, candles, step line, HLC area, Baseline, Heikin Ashi, Renko, and Kagi to best suit their analysis style.
Adjustable Lines: Tools such as trend lines, rays, and extended lines can be configured to analyze market trends and resistance levels.
Customizable Channels: Includes options for parallel channels, regression trends, flat tops/bottoms, and disjoint channels, facilitating detailed trend analysis.
Fibonacci Tools: Extensive Fibonacci tools like Fib retracement, Fib channel, Fib Speed Resistance Fan, Fib Circles, and Fib Wedge for sophisticated technical analysis.
Recognizable Patterns: The platform can identify and allow users to adjust patterns such as XABCD, Cypher, Head and Shoulders, Triangle, Three Drives, and Elliot Waves, enhancing predictive capabilities.
Projections: Tools to project long positions, short positions, Ghost Feed, and Anchored VWAP help in planning and forecasting market movements.
Advanced Charting: Users can choose from various chart types such as bars, candles, step line, HLC area, Baseline, Heikin Ashi, Renko, and Kagi, tailored to different analytical preferences.
Comprehensive Data Display: Daily and 52-week trading ranges, along with key statistics such as market cap, dividend yield, and price to earnings ratios are readily accessible.
Dynamic Alerts and Notifications: A responsive alert system notifies users of significant market events or price changes, enhancing timely decision-making.
Detailed Financial Metrics: Includes next earnings reports, average volume, basic EPS, shares float, and Beta. Visual tools like earnings charts, performance graphs, and seasonal patterns provide deeper insights.
Customizable Analysis Tools:
Adjustable Lines and Channels: Users can set trend lines, rays, extended lines, parallel channels, and more to analyze market trends and potential trading zones.
Fibonacci Tools: Comprehensive Fibonacci applications such as retracement, channels, and fans support sophisticated technical analysis.
Pattern Recognition: Identifies common trading patterns and projections, including Head and Shoulders, Triangle, and Elliot Waves, aiding in predictive analysis.
Empower Your Financial Platform:
Integrating these sophisticated tools into your financial platform can dramatically enhance user engagement and retention by providing comprehensive solutions that improve decision-making processes. Our demo not only showcases our technical proficiency but also demonstrates how similar features can be seamlessly integrated into your applications.
Explore and Discover:
We invite you to visit our demo to experience firsthand how these advanced charting tools and analytical capabilities can be utilized to transform your financial services. Explore the potential and discover how our expertise in fintech can help position your offerings at the forefront of the financial technology revolution.
< Technologies Used >


< Screenshots >